Suppose two trackers run on the same page for a week. One records 700 visits and the other records 900. It is tempting to call the difference 200 blocked visits. That conclusion requires information neither total contains.
Even if you simplify the problem to one visit per person and assume both trackers count perfectly whenever they receive an event, you still do not know how many visits both missed. You do not even know how many visits they share.
This matters when someone uses the larger dashboard as a correction factor for the smaller one. A ratio between two observed populations is not a measurement of the population outside both.
The missing cell
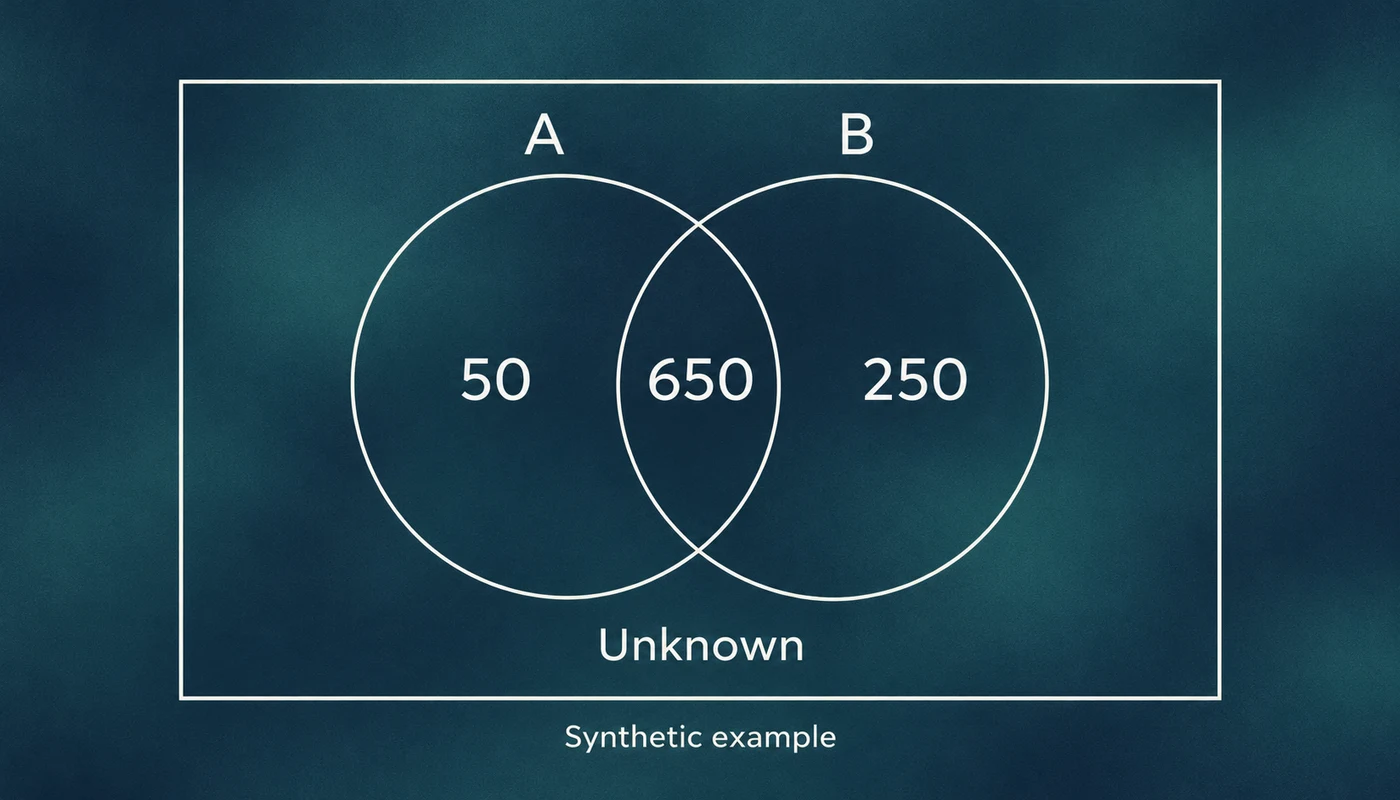
Here is a synthetic example, not Zenovay traffic. During one fixed seven-day window, assume each eligible visit has exactly one opportunity to send an event to each tracker. Every received event is valid, and the two systems use identical visit definitions.
| Observation | Visits |
|---|---|
| Received by both trackers | 650 |
| Received only by A | 50 |
| Received only by B | 250 |
| Received by neither | Unknown |
A reports 700. B reports 900. Together they observed 950 distinct visits. Their difference is 200, although B observed 250 visits absent from A, while A observed 50 absent from B.
Without event-level overlap, even the union of 950 is unavailable. With overlap, the unobserved cell remains unknown. Add another 50 visits that neither tracker received and the total becomes 1,000. Add 1,050 instead and it becomes 2,000. Every number in both dashboards stays the same.
# Synthetic visits during one seven-day window.
tracker_a = set(range(700))
tracker_b = set(range(650)) | set(range(700, 950))

assert len(tracker_a) == 700
assert len(tracker_b) == 900
assert len(tracker_a & tracker_b) == 650
assert len(tracker_a | tracker_b) == 950

for unseen in (50, 1050):
    total = len(tracker_a | tracker_b) + unseen
    print(total, round(100 * len(tracker_a) / total, 1))
1000 70.0
2000 35.0
The same observed counts are compatible with A covering 70% or 35% of visits. These are constructed possibilities, not estimates of real coverage.
Why the trackers miss the same visits
In an idealized capture-recapture calculation, you might estimate a population as 700 * 900 / 650, or about 969 visits. The two-list estimator’s assumptions include a closed population, correct matching, equal capture probabilities within a list, and independence between lists. The formula does not establish that these assumptions hold for two browser trackers.
Two browser trackers share failure modes. JavaScript can be disabled. A consent decision can prevent both tags from loading. A visitor can close the page before either event leaves. A content-blocking rule can match both collection endpoints. Visitors who are hard for A to observe may also be hard for B to observe. That dependence makes the independence assumption unsafe without further evidence.
There is a useful historical example. Plausible published a comparison of its counts with Google Analytics. The Hacker News discussion challenged the denominator: visitors absent from both tools would be absent from the comparison too. The comparison can describe the difference between those implementations on that audience. It cannot establish a universal blocking rate.
Nor does a successful browser API call prove ingestion. sendBeacon() returns true when the browser queues the data. It does not return a receipt from your analytics database. To investigate delivery, distinguish the event being queued, the collector accepting it, and the event appearing in the report.
The server log is another observation mechanism
Moving the denominator to an HTTP log helps answer different questions. It does not turn requests into people.
A request can come from a crawler or a link-preview fetcher. One browser can request a document repeatedly. An origin log can omit requests served from an upstream cache. The logging layer and the URL filter determine what enters the count. Start with document requests in the same window, not every image, script and health check.
AI traffic needs another distinction. OpenAI documents separate agents for search crawling, training-related crawling and user-triggered retrieval. A fetch made to answer someone’s question is not evidence that the person opened your website. A crawler request is not a human referral from an AI product. Keep those categories separate even when both involve the same provider.
Bot filtering also differs between products. Google Analytics automatically excludes known bots, but does not expose a count of the excluded traffic in that feature. That is not a promise to recognize all automation. Cloudflare describes its bot score as a likelihood assessment. Neither a browser-looking user agent nor the absence of a bot label proves a request came from a person.
If the server says 10,000 and the browser says 6,000, the remaining 4,000 are unexplained requests under those counting rules. Calling them blocked humans skips the investigation.

A visitor count depends on an identity rule
Before comparing collection, check whether the reports count equivalent units. One page load can emit multiple events. Several page loads can belong to one session. One person can have several device identifiers.
GA4’s reporting identity can use User-ID, device identifiers and, in its blended setting, modeling. A device-based report and a report that joins signed-in activity need not return the same user count from the same events.
Zenovay has a different, documented boundary in its cookieless identity mode: the visitor key rotates daily. Returning across that boundary can produce a different key. People sharing the identity inputs can be grouped together. Those are consequences of the identity rule, not events an ad blocker necessarily removed. Hashing the inputs does not turn the resulting identifier into a census of people.
This is why a weekly unique count cannot always be reconstructed by adding daily uniques. A stable identifier might be deduplicated across days; a rotating identifier cannot supply that same continuity. Agree on the identity window before using either number as the denominator of a conversion rate.
Attribution changes the story after collection
Even if both tools receive the purchase, they can disagree about who gets credit.
First check the available path. A missing campaign parameter or referrer can erase evidence of acquisition. Under Referrer-Policy: no-referrer, the browser omits the referrer. The default cross-origin policy generally sends the origin, not the full referring path. A report with no usable source does not establish that someone typed the address.
Then check the allocation rule. Google documents attribution models as rules or algorithms for assigning credit. In its attribution reports, direct visits normally receive no credit unless the path is entirely direct. A tool that simply credits the final recorded visit can therefore disagree with GA4 without losing a purchase. Different lookback windows can remove earlier touches before either model runs.
Changing the credit allocation leaves the purchase intact. It does not recover an unseen first visit, and it does not establish whether the purchase would have happened without a campaign. That needs a comparison designed to answer the causal question.
Reconcile one event before correcting a total
Choose one complete reporting window and write down what each row represents. Include the time zone, hostname scope, identity window, bot treatment and whether modeled data enters the report. Record when you exported it, because processing can change an incomplete period.
Then use an authorized test visit to trace a specific action. Confirm the destination page, the consent state, the request the browser attempts, the collector response and the stored event. If a synthetic test identifier is appropriate, keep it short-lived and out of customer reports. Do not introduce persistent cross-tool identity just to make two totals agree.
For purchases, reconcile stable transaction IDs and amounts against the payment system, accounting for refunds and the reporting window. That checks recorded purchases. It still does not reveal every visitor who considered buying and left before either tracker observed them.
The useful result might be narrow: “B receives these test events and A does not under this blocking configuration.” That is reproducible. “We recovered 22% of our missing people” needs a denominator the two dashboards have not supplied.