Revenue attribution
Know what brings revenue.
Which channels, campaigns and pages bring paying customers, not just visitors. Revenue per visitor and order value per source, updated as payments come in.
How attribution worksReal-time analytics that follow every visit through to the payment, so you can fund the channels that earn and drop the ones that never will.
Cookieless · Real-time · Hosted in Zürich and Amsterdam · Made in Switzerland
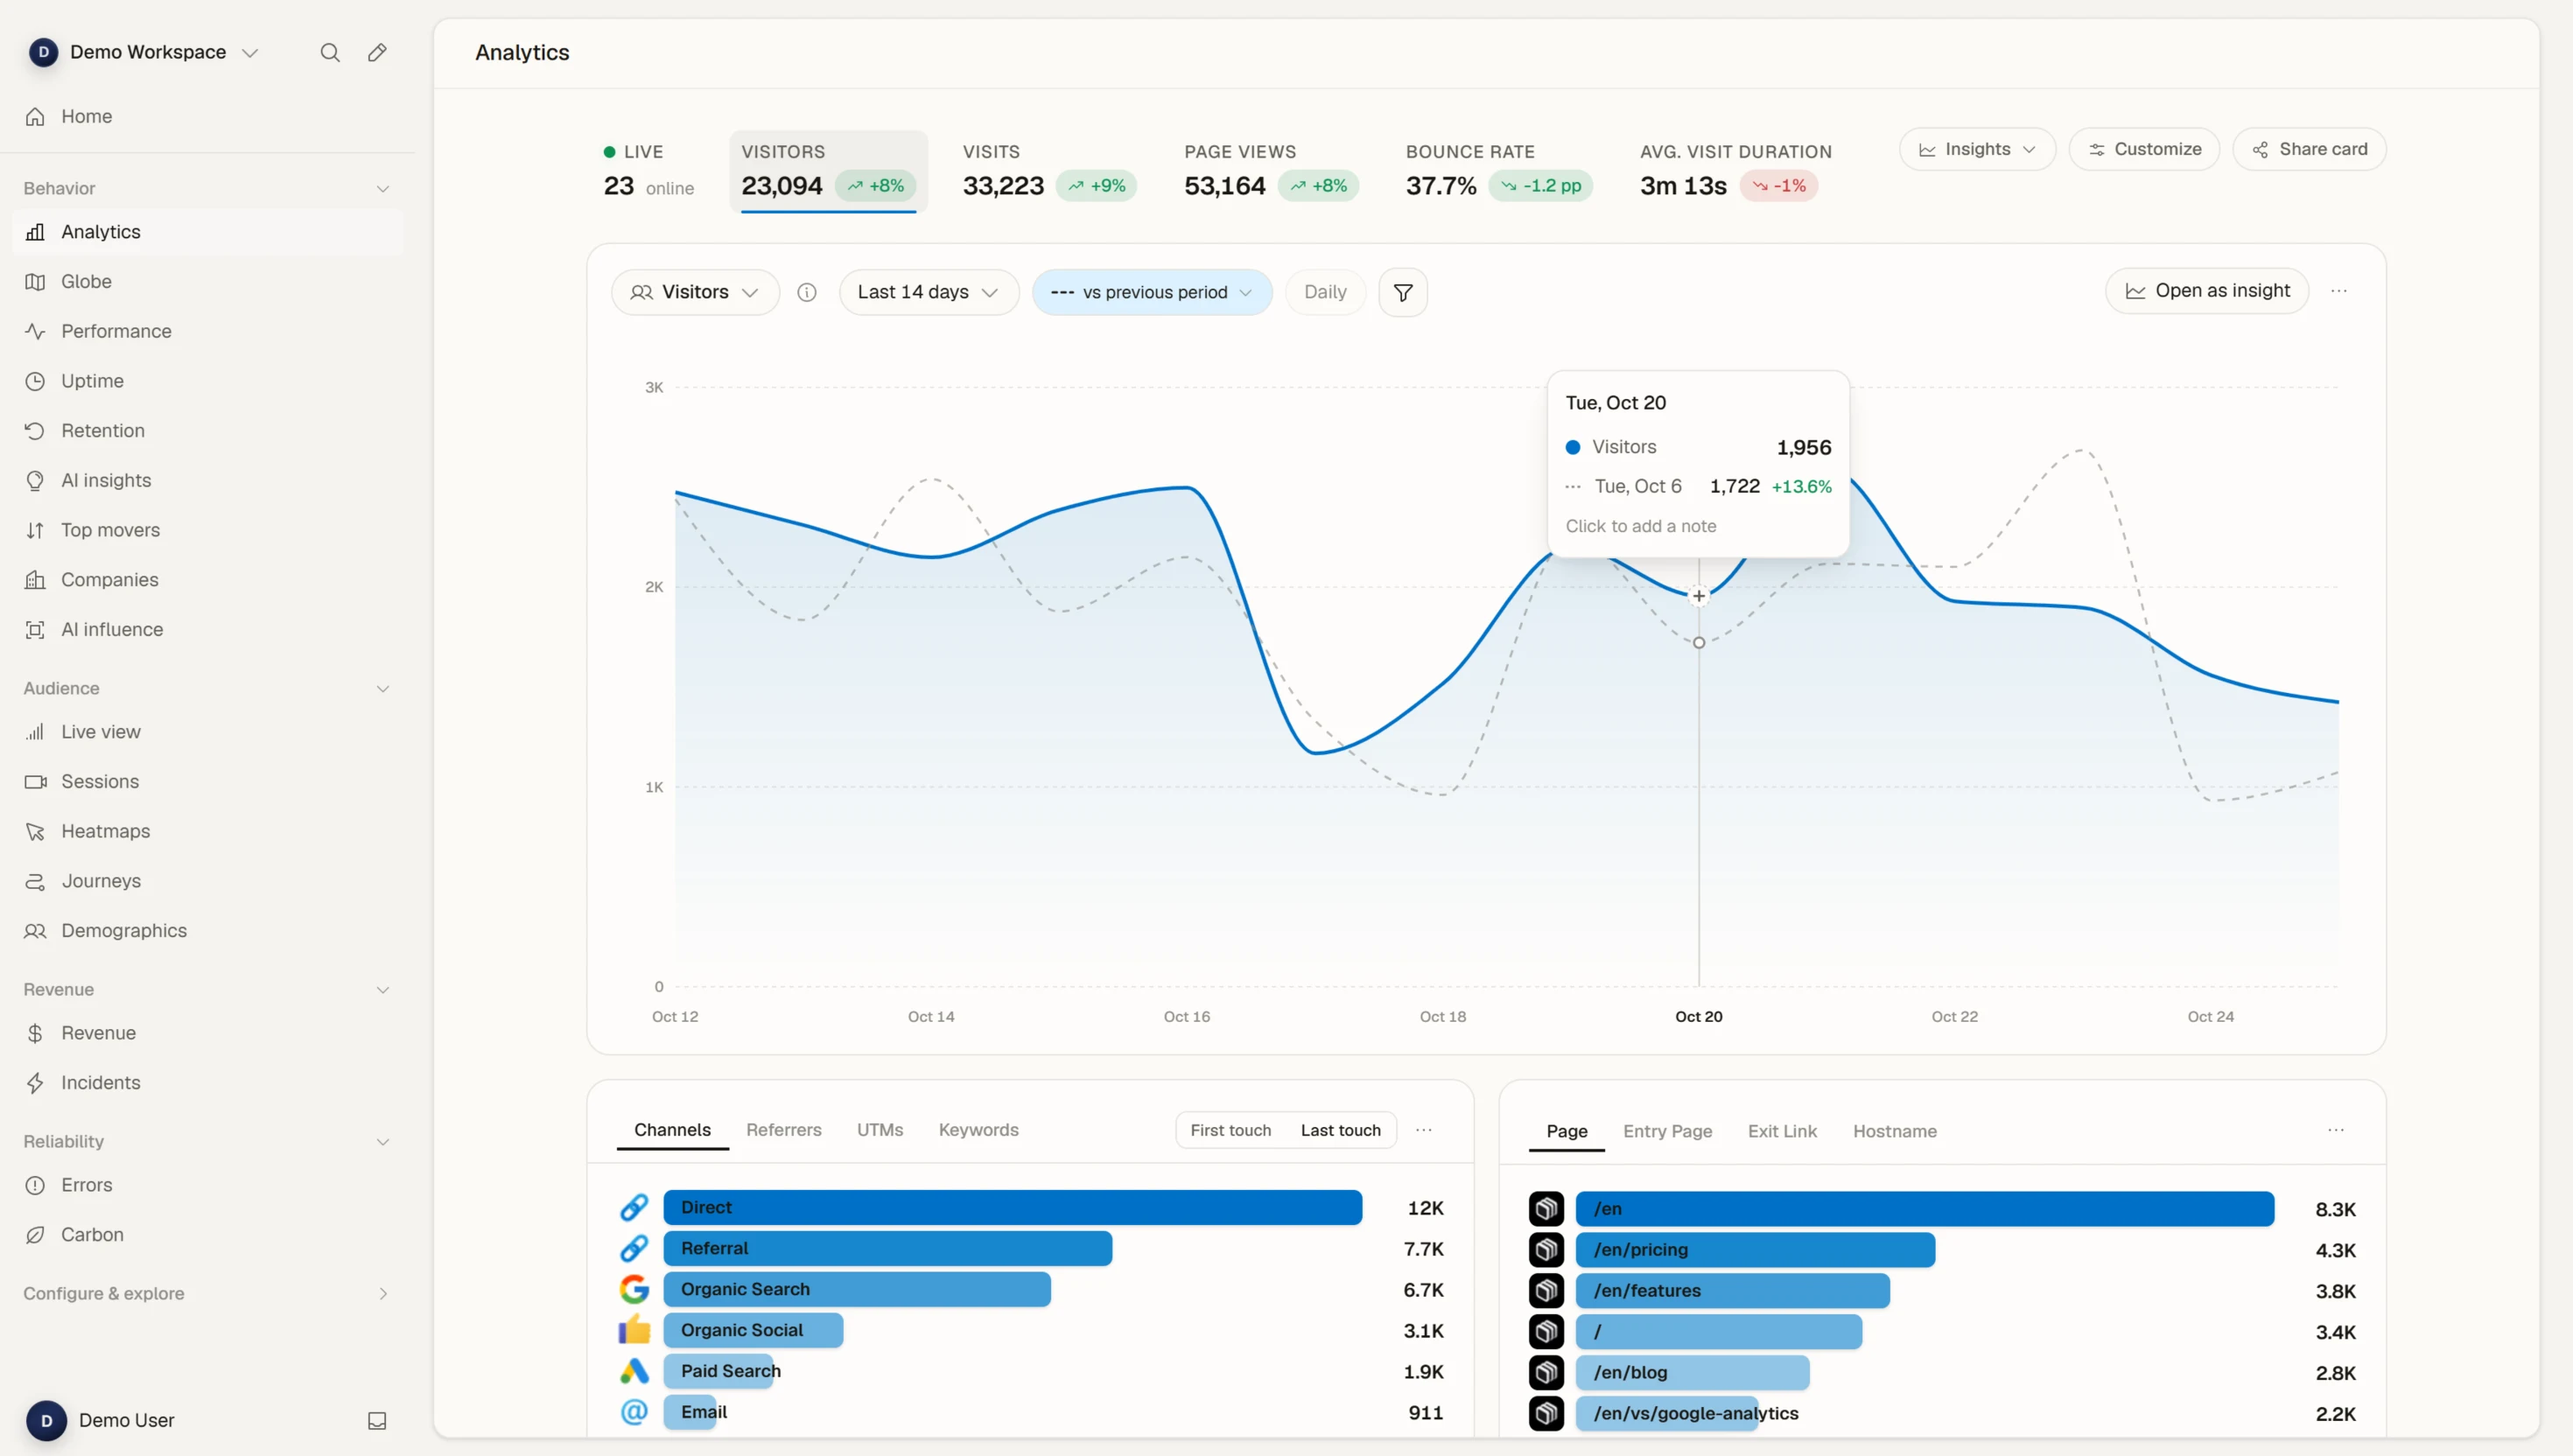
Not pageviews. Not sessions. Real money, traced back to the click that earned it.
One script, one payment connection, and every visit is followed through to the money it made. No tag manager, no data team, no cookie banner.
<script defer data-tracking-code= "YOUR_TRACKING_CODE" src= "https://api.zenovay.com/z.js"> </script>
Paste one script tag into your site, or follow the guides for Next.js, WordPress, Shopify and Webflow. Visits show up within seconds.
Link Stripe or PayPal in a couple of clicks, or send purchases through the revenue API. Every payment is matched to the visit that led to it.
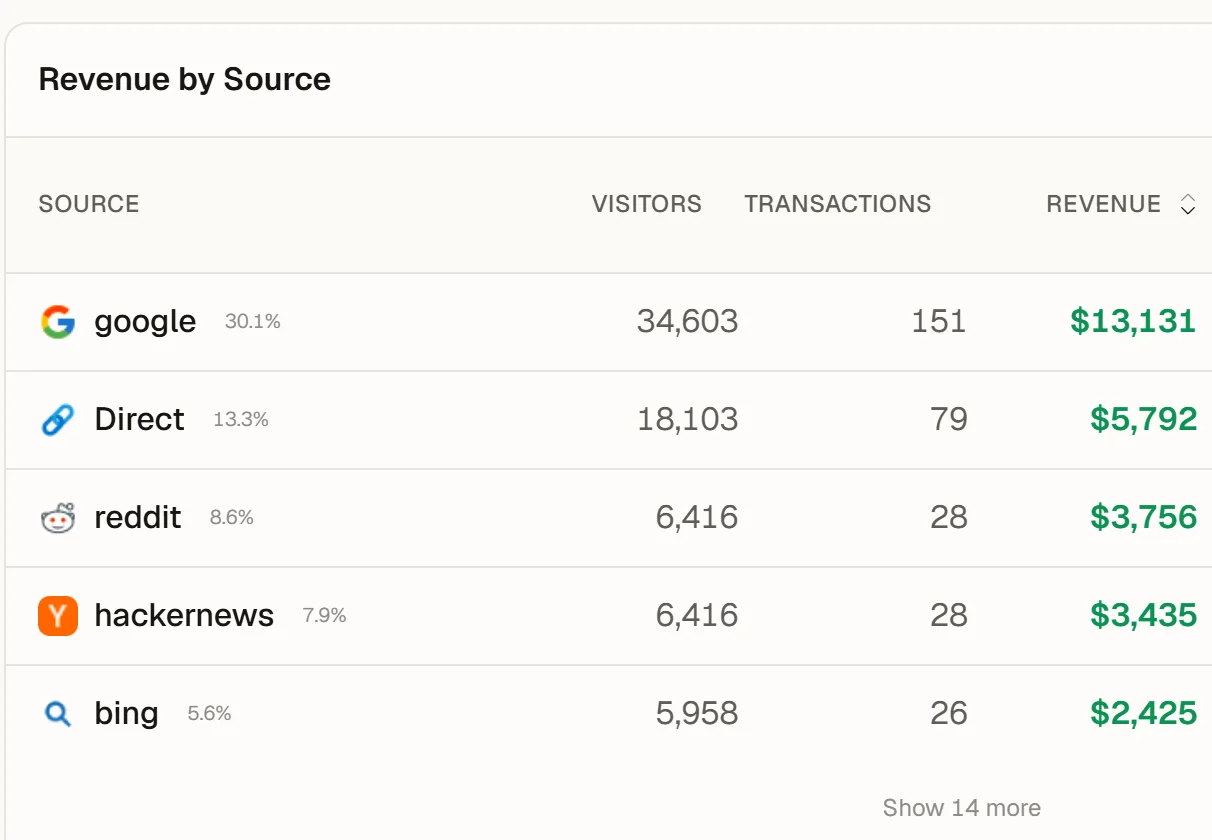
Revenue per channel, campaign and page, next to the funnel it came through. Put budget where the money is.
Free plan, no card needed. Most sites are live in five minutes.
One clear view of every visit, source, and conversion across your business. Built for founders who'd rather ship than read dashboards.
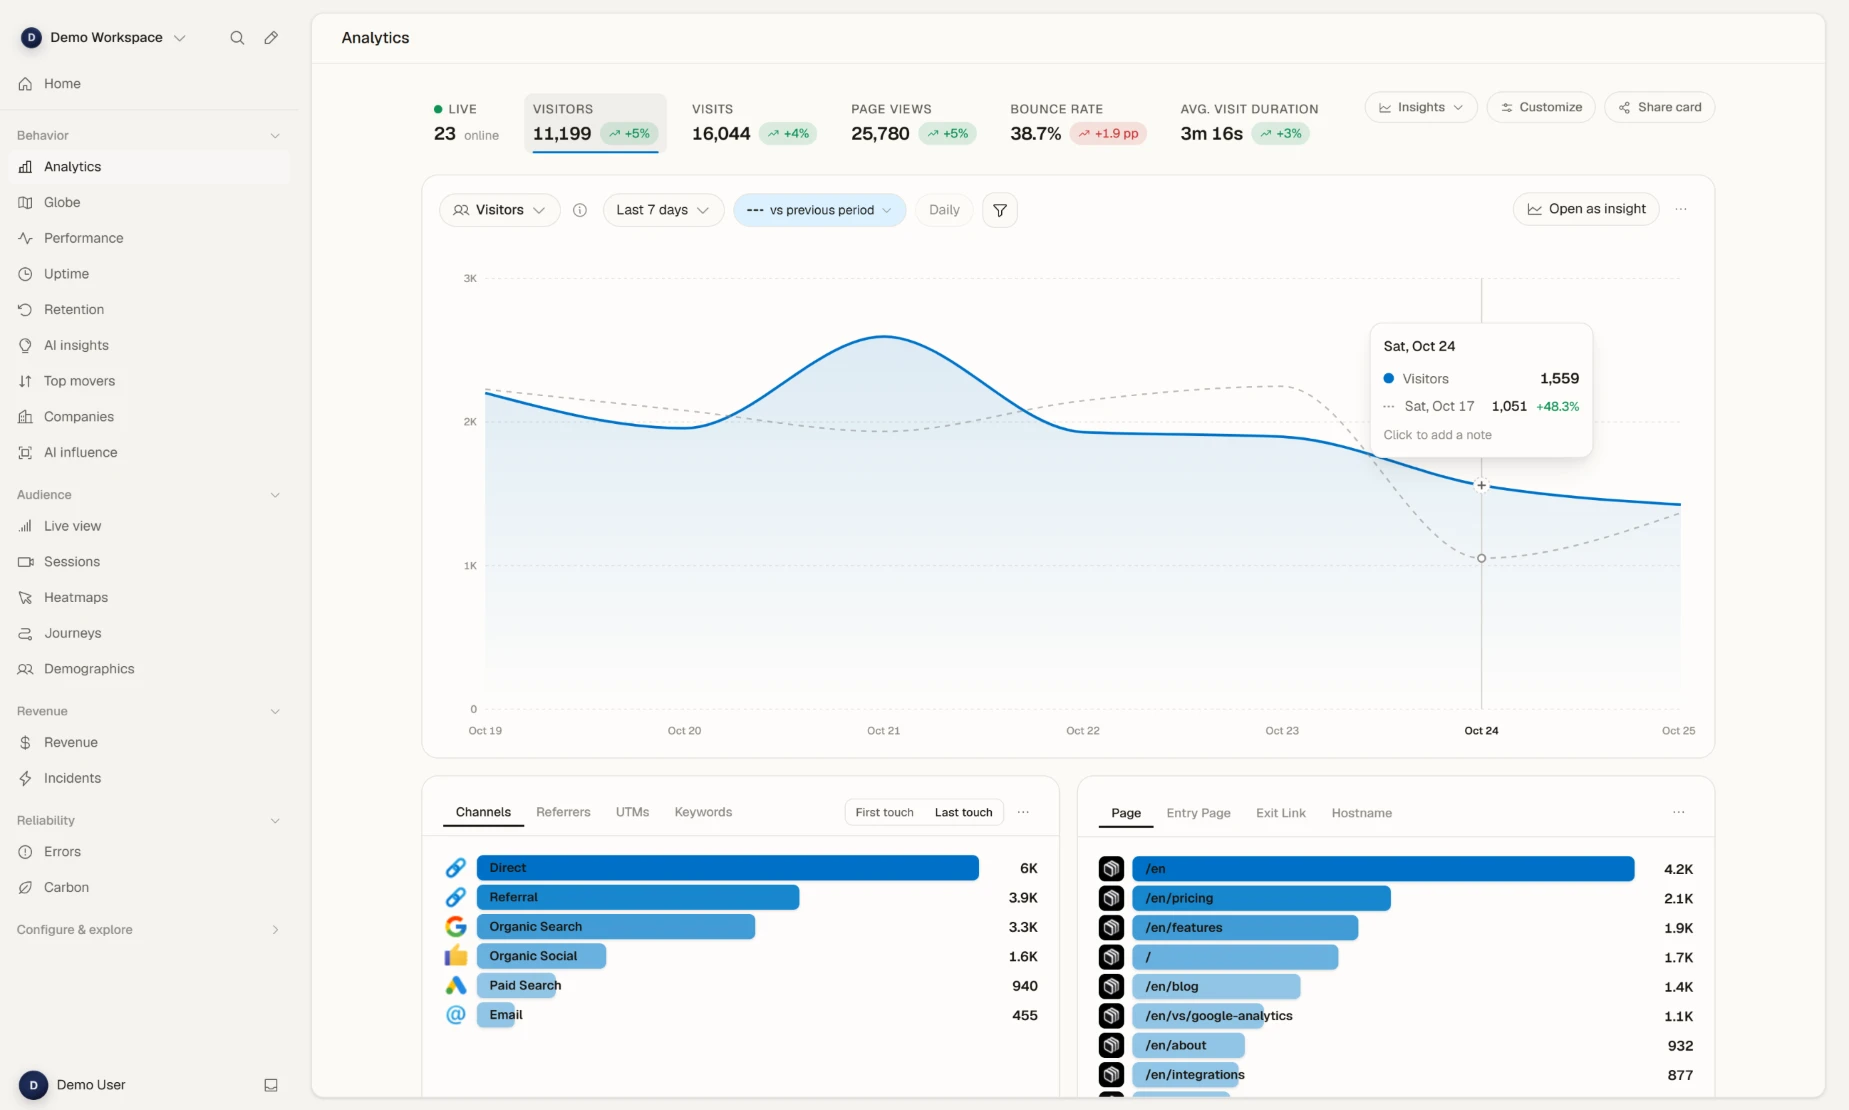
Hover the chart. Switch ranges. Click any channel. This is the real Zenovay UI.
Connect Zenovay to Claude Code, Cursor, VS Code or Windsurf over MCP. Your agent reads traffic, revenue, errors and performance next to your code, so it can analyze errors, monitor performance, trace a regression to the commit that caused it, and fix it in the same session. One URL, one login, nothing to install.
claude mcp add --transport http zenovay-analytics https://api.zenovay.com/mcpClaude Code v2.1.268
Opus 5 · Claude Max
~/projects/zenovay
/mcp
Authentication successful. Connected to zenovay-analytics.
Our website’s performance has deteriorated significantly. Use the Zenovay MCP to identify the issue, then fix it in the landing-zenovay repo.
I’ll start by pulling the performance data from the Zenovay MCP to understand what’s happening, then look at the repository.
Listed 1 directory, called zenovay-analytics 11 times, ran 1 shell command
Clear signal: /en/ is the worst offender. Let me get page-level detail and dig into the repo.
| Page | Load time | Last week | Change |
|---|---|---|---|
| /en/ | 4.8 s | 1.9 s | +2.9 s |
| /en/pricing | 2.0 s | 1.9 s | +0.1 s |
| /en/features | 1.9 s | 1.8 s | +0.1 s |
Called zenovay-analytics 2 times, ran 19 shell commands
Let me pinpoint when this regressed by comparing metric windows.
Read 1 file, called zenovay-analytics 3 times, ran 2 shell commands
Found it. Load time jumped on Tuesday at 14:10, right after deploy a41f2c0 added the chat widget as a blocking script in the head of every page. Fixed in app/layout.tsx: it now loads after the page, with defer.
- <script src="https://cdn.chatwidget.io/v2.js" />+ <script defer src="https://cdn.chatwidget.io/v2.js" />
14 tests pass. Want me to open the pull request?
Integrate the tools you love.
CLASSIC ANALYTICS VS. ZENOVAY
+ Attributed
$012,847 sessions ·3 buyers
Three sessions paid for the rest. We can show you which.
Six things your current analytics tool doesn’t do.
Start free. Scale as you grow. No hidden platform fees.
Prices are shown in USD, CHF, or EUR based on your billing country. Existing subscriptions keep their original currency.
Subscriptions auto-renew at the end of each billing period. You can cancel anytime from the dashboard; cancellation takes effect at the end of the current paid period.
Prices are exclusive of any applicable VAT, GST or other indirect taxes, which are added at checkout based on your billing country.
See refund and cancellation terms in our Terms of Service.